Optimization of Dublin Bike Stations
-
Introduction
- The objective of this project was to optimize Dublin bike stands to reduce fullness, particularly in the afternoon, in a section of the city. This aimed to minimize user frustration and improve the overall experience by ensuring availability at bike stations.
-
Data Manipulation and Preparation
- Time Periods: Divided into morning (5 am - 10:59 am), afternoon (11 am - 2:59 pm), evening (3 pm - 7:59 pm), and night (8 pm - 4:59 am).
- Fullness Metric: Created a ‘fullness’ variable to represent the proportion of available bikes to total stands, with a threshold set at 90% for practical considerations.
-
Methodology
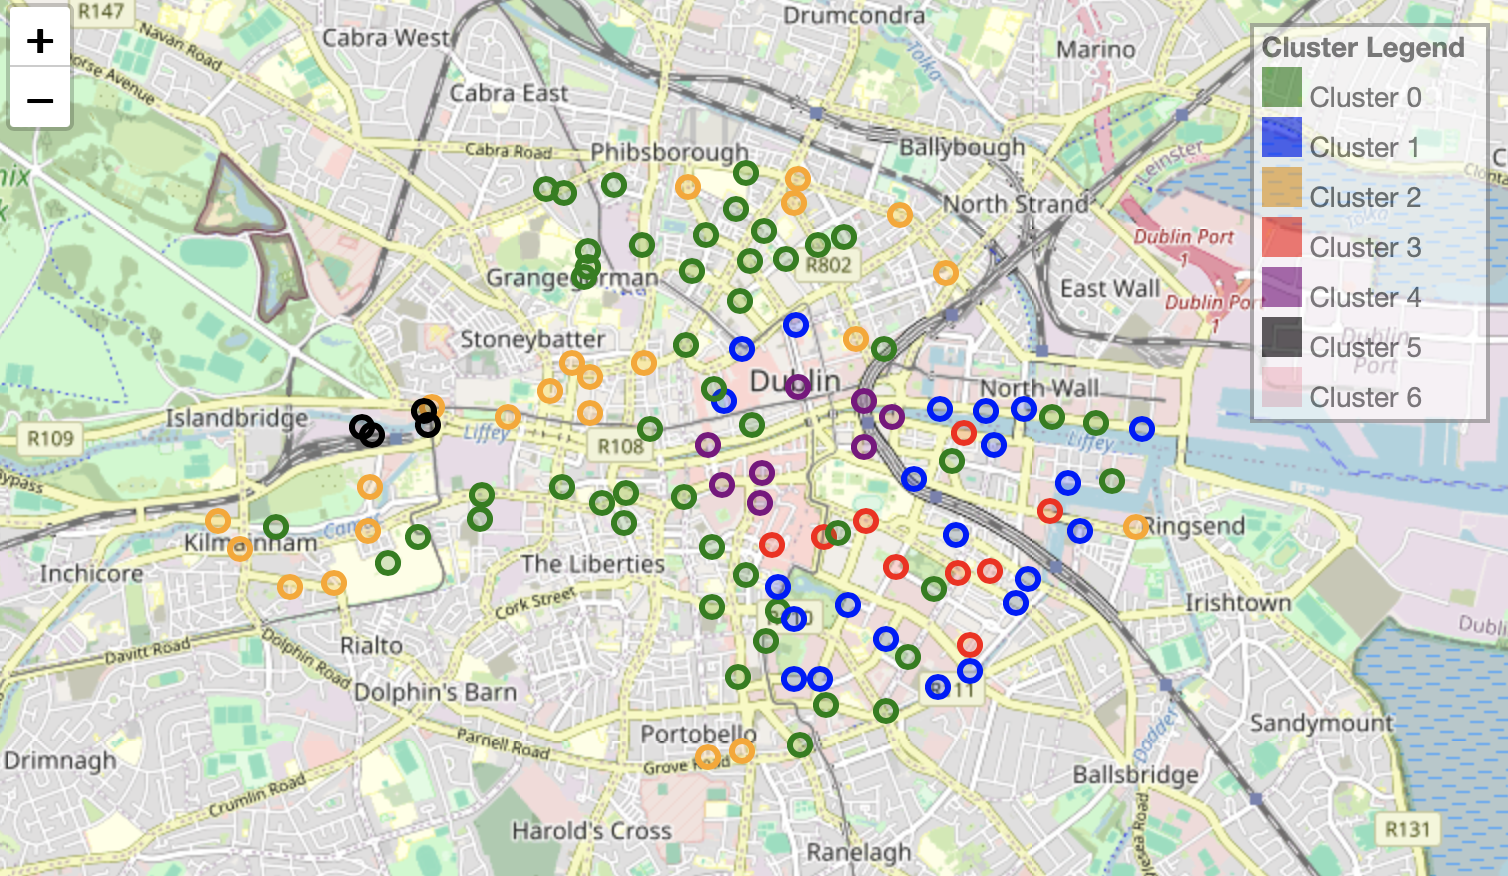
- Clustering: Used K-means clustering on longitude, latitude, and afternoon fullness to identify areas with high fullness. Cluster analysis helped identify stations requiring optimization.
- Regression Analysis: Simple linear regression was performed to understand the relationship between the number of bike stands and fullness during different time periods.
-
Results
- Identified five bike stations with high afternoon fullness for capacity increase and five stations with lower usage for reduction.
- Regression models indicated a negative correlation between the number of stands and fullness, guiding the redistribution of bike stands.
-
Conclusion
- The optimization strategy led to a predicted decrease in fullness during peak times at the targeted stations, improving user experience. Future steps involve incorporating seasonality and further data analysis to refine the model.